Review of development
General
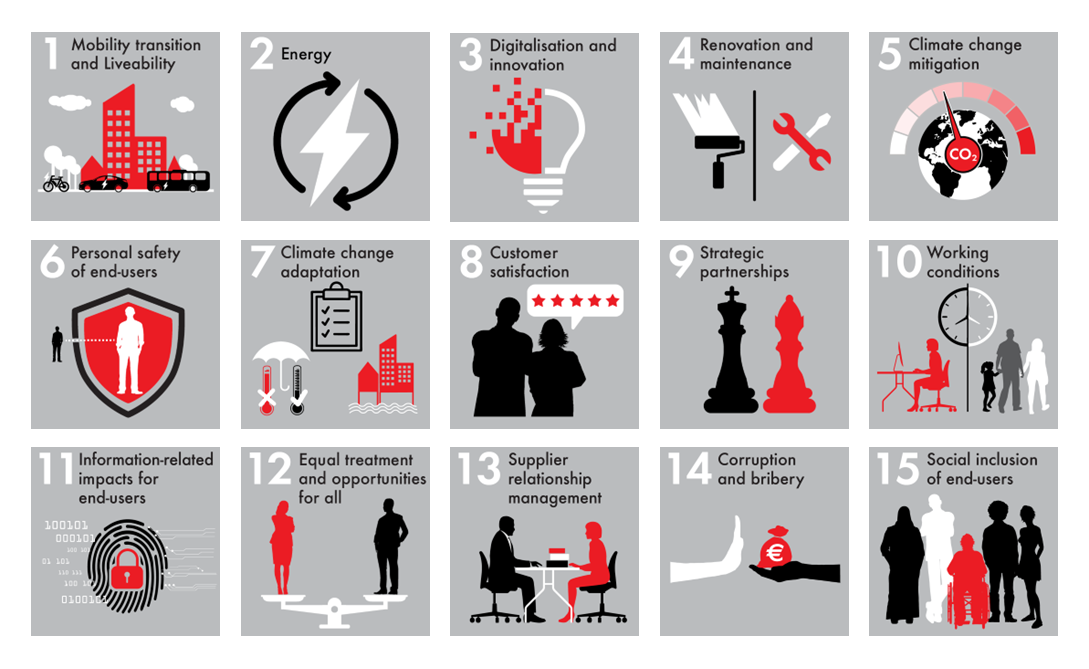
In 2023 we developed our new CSR Strategic Framework including a double materiality analysis from which we have defined our key sustainability matters, our ambition and three focus areas.
The top 5 sustainability matters identified are Mobility transition and Liveability, Energy, Digitalisation and Innovation, Renovation and Maintenance and Climate change mitigation.
Other sustainability matters which deserve our attention are Personal safety of end-users, Climate change adaptation, Customer satisfaction, Strategic partnerships, Working conditions, Information-related impacts for end-users, Equal treatment and opportunities, Supplier relationship management, Corruption and Bribery, and Social inclusion of end-users.
Figure 7 Top 15 sustainability matters
We are steadily progressing with our Sustainable Mobility Partnership (SMP) Programme, supporting cities to achieve their sustainable urban mobility plans (SUMPs). And we have established a clear definition for Q-Park Mobility Hubs, added strategic mobility partnerships and have over 170 Q-Park Mobility Hubs in our portfolio.
We have also developed a roadmap for the coming years including a multi-year communication plan as an overarching layer for the Q-Park story that (i) builds on the renewed positioning (purpose, vision, focus); (ii) expresses Q-Park's unique long-term value proposition as a sustainable mobility partner; and (iii) reflects our sustainability ambition.
The roadmap for our Energy Portfolio Management has deploying EV charging points at its core, including balancing energy supply and demand, and addresses renewable energy procurement.
Key results summary
We report our results over 2023 and where we have data available of previous years, we show comparable results.
Sustainable mobility services include transforming search traffic to destination traffic and is enhanced with:
506 PFs offering online pre-booking (2022: 476), an increase of 6%;
225 PFs near public transport hubs (2022: 220) an increase of 2%.
Digitalisation is about expanding our smart back-office systems and business intelligence instruments to improve informed decision making, and providing more online information and enabling pre-booking solutions at more parking facilities (PFs) for our customers. We continue to move forward in digitalising our business, our partnerships and our customers' journeys.
A key aspect to optimising digitalisation is unlocking PFs with automatic number plate recognition (ANPR) via our proprietary platform PaSS (Parking as a Smart Service). In 2023, PaSS enabled PFs increased from 368 (2022) to 459 (2023), an increase of 25%.
Our Cybersecurity Awareness Programme was rolled out in 2019 and remains active and relevant in 2023. It includes online training, with 92% of all employees having completed the e-learning programme.
For us at Q-Park, the mobility transition means supporting the electrification of the car fleet in western Europe by significantly increasing the number of EV charging points (EV CPs) installed in our PFs. We now have:
4,114 EV CPs (2022: 2,831), an increase of 45%;
2,996 EV CPs generating revenue
3,265 EV CPs in operated PFs
4,114 EV CPs in operated and managed PFs
283 PFs offering EV charging (2022: 235), an increase of 20%.
Chart 1 Parking facilities offering EV charging
Chart 2 Total EV charging points
The total energy consumed in our operated parking facilities amounted to 88.4 GWh compared to 95.8 GWh in 2022, a decrease of 8%.
This total excludes the energy consumed by the 3,265 EV charging points in the operated parking facilities: 10.2 GWh in 2023 versus 5.4 GWh in 2022, an increase of 90%. This sharp rise in energy consumption by EV charging points can be attributed to our expansion programme and the upsurge in EV charging point usage by our customers.
Chart 3 GWh consumed by operated PFs and their EVs
Part of our liveability perspective is reducing our energy consumption and carbon footprint. Our carbon footprint per parking space in our operated PFs is lower compared to 2022.
In 2023, we calculated the average kgCO2 per parking space to be 45.4 (2022: 48.3).
Since we started measuring our emissions in 2010, we have already achieved a 75% reduction in our carbon footprint per parking space.
Also note:
Potential differences between previously reported 2021 and 2022 data points can be attributed to replacing extrapolated data with actual data.
The market-based calculations as of 2022 allow tracking of the impact of decisions made by Q-Park in energy sourcing.
GWh consumed by EV charging points operated by Q-Park is available from 2022. We extrapolate the energy consumption data we have of operated EV charging points (2023: GWh 9.72) to the total EV charging points in portfolio, excluding those in managed parking facilities.